

Why do you need to be familiar with digital marketing analytics as a business owner?
What are the most important analytics to understand (at least at first) so you’re not wasting time trying to figure it out?
What the heck are analytics anyway?
If you’re in business, you already know how important data is to measure your success. For example, you track your sales data on a daily basis to gauge how your business is doing, along with customer counts and transactions, etc.
Digital analytics is another term for data that is used to gauge the performance of your digital marketing, including your website, social media, email campaigns, digital ads, etc. When you use analytics to track and measure your progress in these areas, you’ll be able to set goals and make improvements to your marketing campaigns and strategies.
To get you started, here’s a run-down of some important analytics to get familiar with for your company’s website, Facebook, Twitter and LinkedIn pages. (It’s best to follow along on a desktop so you can see how the features work).
1. Google Analytics:
If you have a website, you should also be monitoring it with this free tool. Google Analytics is the most widely-used marketing analytics platform on the web. You can use it to obtain detailed data on your website visitors and how they use your website. To find your website analytics, go to google.com/analytics and log-in with the email address associated with your website account.
Some basic analytics to track for your website include:
Audience Overview: This is the default setting when you first open Google Analytics, which includes data over a timeframe that you select (the default is 30 days). I like to track each month and compare it to the same month last year. You can do this with the date tool in the upper right hand corner (click the drop-down, check the “compare to” box, and set your dates). The key analytics to monitor in this section include:
# of Sessions: How many times your site has been visited by new or returning visitors.
# of Users: How many total people visited your site.
# of Pageviews: How many total pages on your site have been viewed during a specific time frame.
# Pages per Session: How many pages are viewed in a typical session.
Average Session Length (Duration): Average length of time that users stay on the site per visit.
Bounce Rate: The percent of users who leave after browsing only one page.
New and Returning Users: What percent of your users are new and what percent are returning.
The line graph at the top of the page shows daily totals when you mouse over the points, which can be a very useful tool to try to gauge peaks in visitor counts.
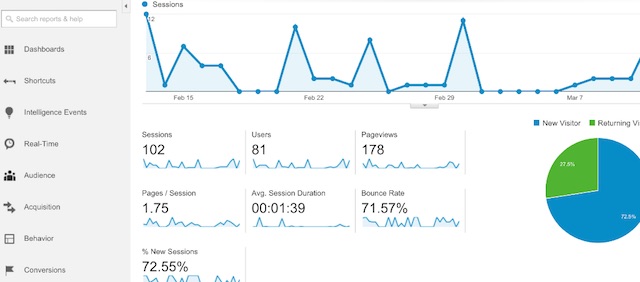
Google Analytics — Overview
Another useful report is found under the “Behavior” tab on the left-side menu. Click: Behavior > Site Content > Content Drilldown
The Content Drilldown report ranks each page on your website by number of page views and shows how much time they spent on each page. This will give you a gauge on how your visitors are using your site and what content they find most valuable. (By the way, the page identified as “ / “ is your homepage).
Want to know how your visitors are finding your website? Check the Channels Report by going to the Acquisitions tab on the left menu and clicking Acquisitions > All Traffic > Channels
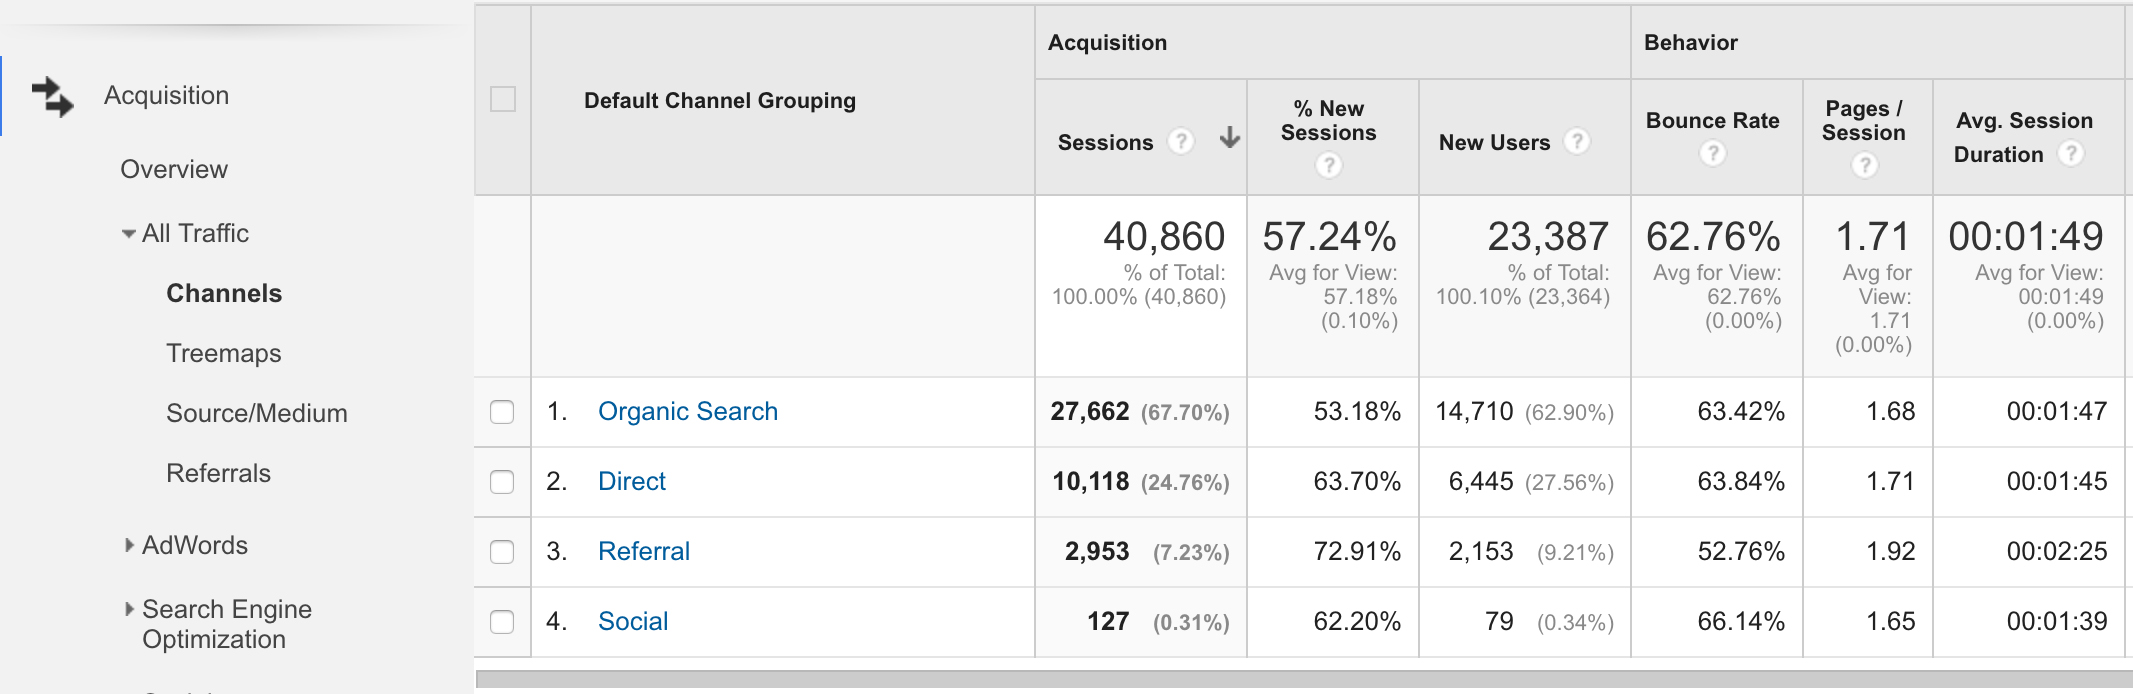
Google Analytics — Channels Report
In this report, you’ll see a ranking of your website’s traffic sources: Direct, Organic (via Google search), Social, Referral (from another website), Email, Paid Search, and Other. Each source is clickable so you can see a breakdown with more detail. For example if you click on Social, you’ll see a breakdown of the social media channels like Facebook, Twitter, LinkedIn, etc.
You can export each report into various formats like Excel, CSV, PDF, etc., for use in spreadsheets or to save the report. You’ll find the “Export” drop-down under the report name in the upper left corner.
Watch Out for Spider-Bots!
There have been incidents of spider-bots (spam) infiltrating Google Analytics data, which grossly inflate your totals. This happened to me recently when I reviewed my website’s analytics and found some very strange websites listed under Referral sources, each showing hundreds of pageviews. Here’s a post from GalaxyWebLinks.com which shows how to easily delete the spider-bot data, so please check it out if you notice the same thing (sorry in advance about the creepy spider picture): http://bit.ly/1SNKjIM
This is just scratching the surface of the data you will find on Google Analytics, but it will get you started. Each report has a little graduation cap in the upper right corner which you can click to get further explanation of the report (many with videos).
2. Facebook Insights
Facebook’s analytics, called Insights, features data that tracks your business page posts and ads. When you land on Insights (you’ll find it in the navigation bar for your page), you’ll be directed to the Overview page which features top-line totals for reach, engagement, likes, actions-on-page, and your top 5 posts.
Facebook Insights — Overview
You can reset the timeframe by clicking the drop-down in the upper left and setting it to whatever timeframe you’re interested in, whether it’s today, yesterday, last week or the past month. You can also expand the post view beyond the top five by clicking “See All Posts.”
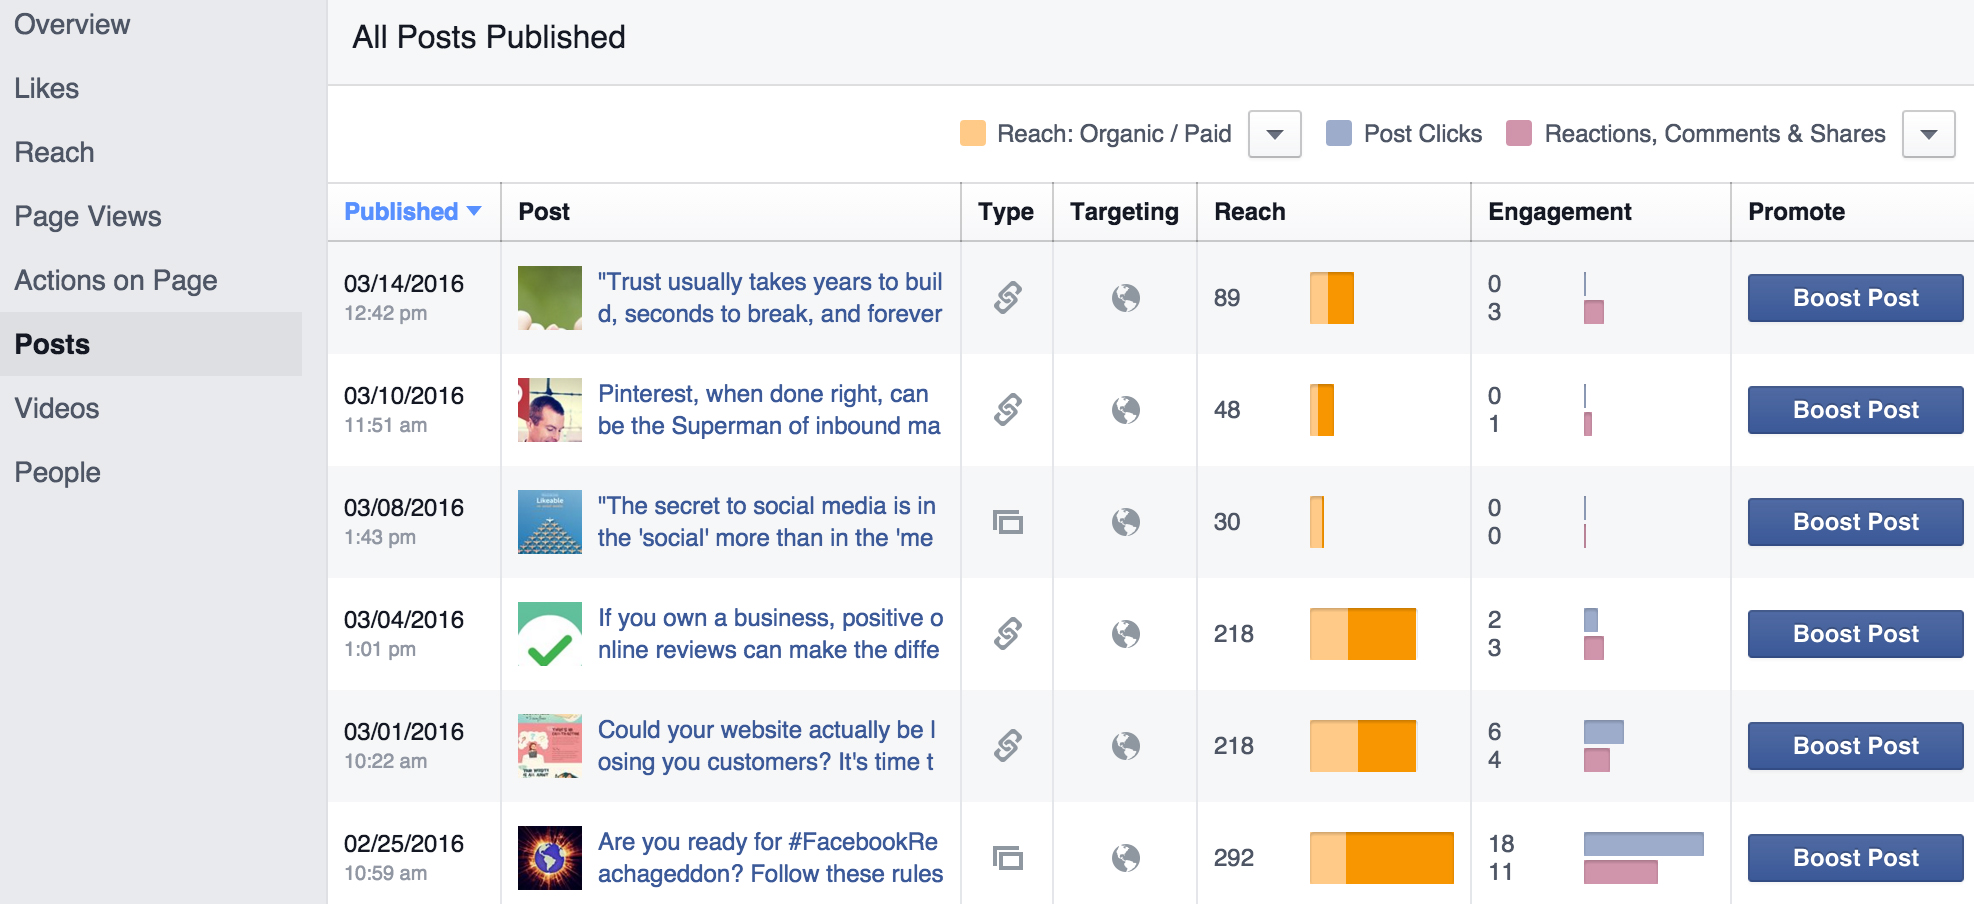
On the left side menu, click “Posts” to see a summary of the days and times your fans are online. This is a nice tool to help you determine the best times to post to reach the most people. When you hover your mouse over each day of the week square, a dark line appears on the chart showing when your audience is online for the day compared to the weekly average.

Facebook Insights — Posts
Scroll down and you’ll see your posts in chronological order (most recent first) and the data for each one, including:
Reach: Organic (not paid) versus Paid (if you boosted the post). If you hover your mouse over the colored bars, it will show you the breakdown.
Engagement: Measures how fans interacted with your posts and includes post clicks, likes (now called “reactions”), comments, and shares. These metrics are important because they show that fans value your post content enough to react to it. You can click the dropdown in the upper right corner “Reactions/Comments/Shares” to get totals for each one.
Facebook Insights — Reach & Engagement
Back to the left menu, click “People” to get a nifty demographic breakdown of male vs female, age categories, country, city, and language. If you’re a local business, the city breakdown will help you gauge whether you’re reaching your local market.
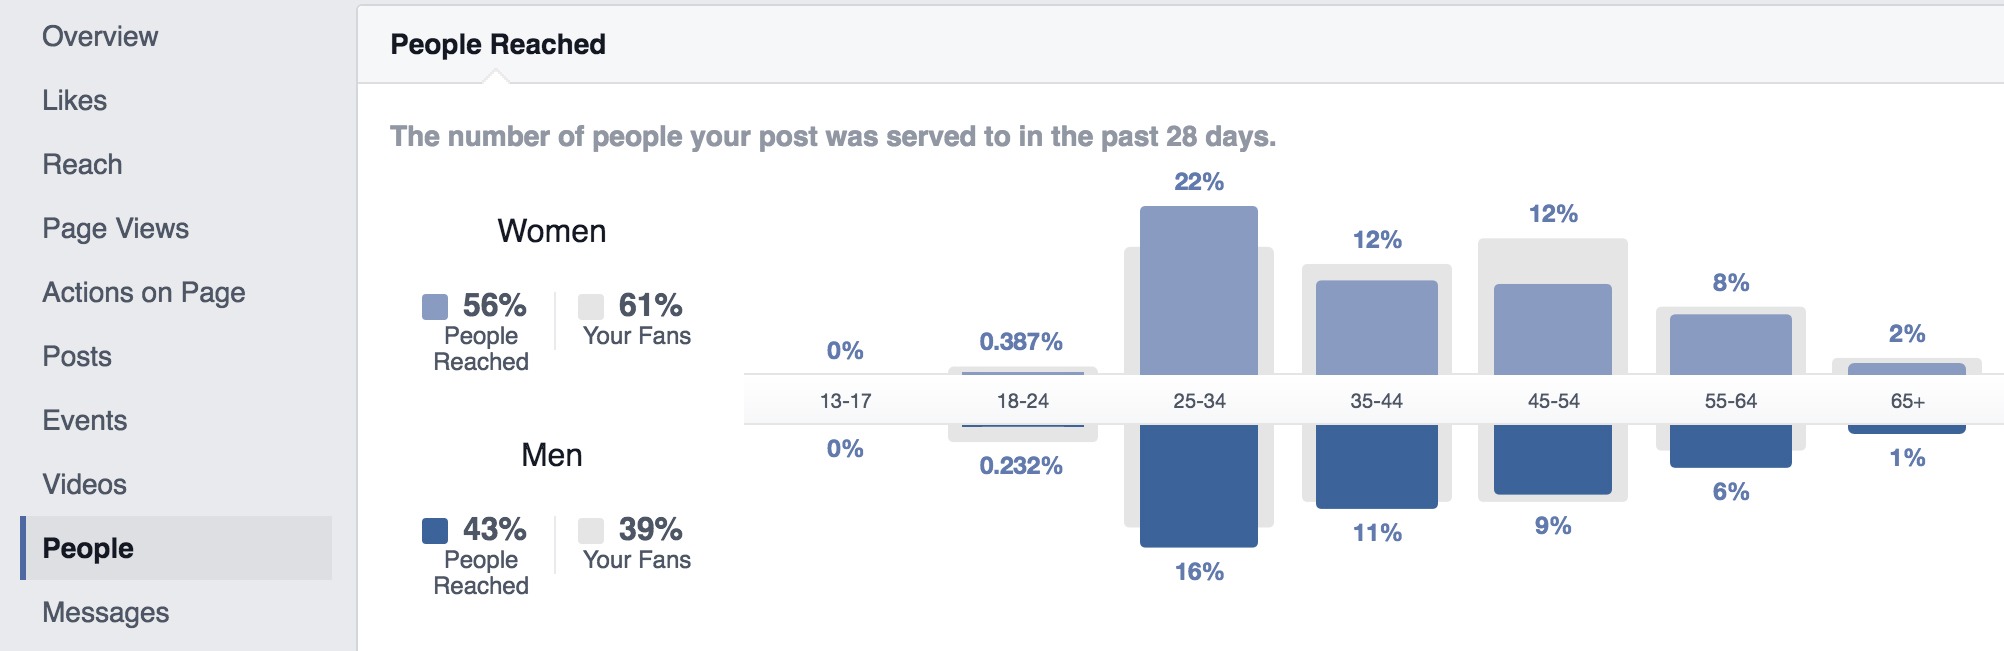
Facebook Insights – People Reached
3. Twitter Analytics
Like Facebook, Twitter offers detailed analytics for tweets and paid advertising. You can find the analytics by going to analytics.twitter.com/user/yourTwitterhandle (insert your Twitter handle at the end). You can also get to it on your Twitter page by finding the “Your Tweet Activity” box on the right side under the “Likes” tab. Click “View Your Top Tweets,” and you will be taken to the analytics site.
Click on “Home” in the upper nav bar and you’ll see a monthly summary with the top tweet, top follower, top mention, and top media.
On the Tweet Activity page, you’ll see a list of your tweets and the corresponding analytics for each one. You can reset the timeframe to last 7 days, last 28 days, or a specific month. Tweet analytics featured include:
Impressions: The number of times users saw the tweet on Twitter.
Engagements: Total number of times a user has interacted with the tweet. This includes retweets, replies, follows, likes, and clicks on links, hashtags, avatars, user name, and tweet expansion.
Engagement Rate: The number of engagements (clicks, retweets, replies, follows, likes) divided by the total number of impressions, shown as a percentage.
This page also shows the averages for each analytic for the timeframe, as well as the top performing tweets.

Twitter Analytics — Tweet Activity
Click on “Audience Insights” and you’ll find some fascinating information about your followers’ interests by category, demographics, lifestyle, and top device categories. This information is very helpful to determine what types of tweets are most effective. Click “add comparison audience” to compare your followers to another group of people by clicking “Persona” and choosing a group.

Twitter Analytics — Audience Insights
4. LinkedIn Analytics
You can find analytics for your LinkedIn business page by clicking the Analytics tab in the navigation bar.
In the Updates section, you’ll see a list of your posts, which you can expand at the bottom. Analytics featured in this section include:
Impressions: The number of times each update was shown to LinkedIn members.
Clicks: The number of clicks on your content, company name or logo. Does not include Interactions or Followers Acquired.
Interactions: Number of times people have liked, commented on, or shared each update.
Engagement: Number of Interactions, Clicks and Followers Acquired divided by number of impressions. Followers Acquired are only included for Sponsored (paid) Updates.

LinkedIn Analytics – Updates
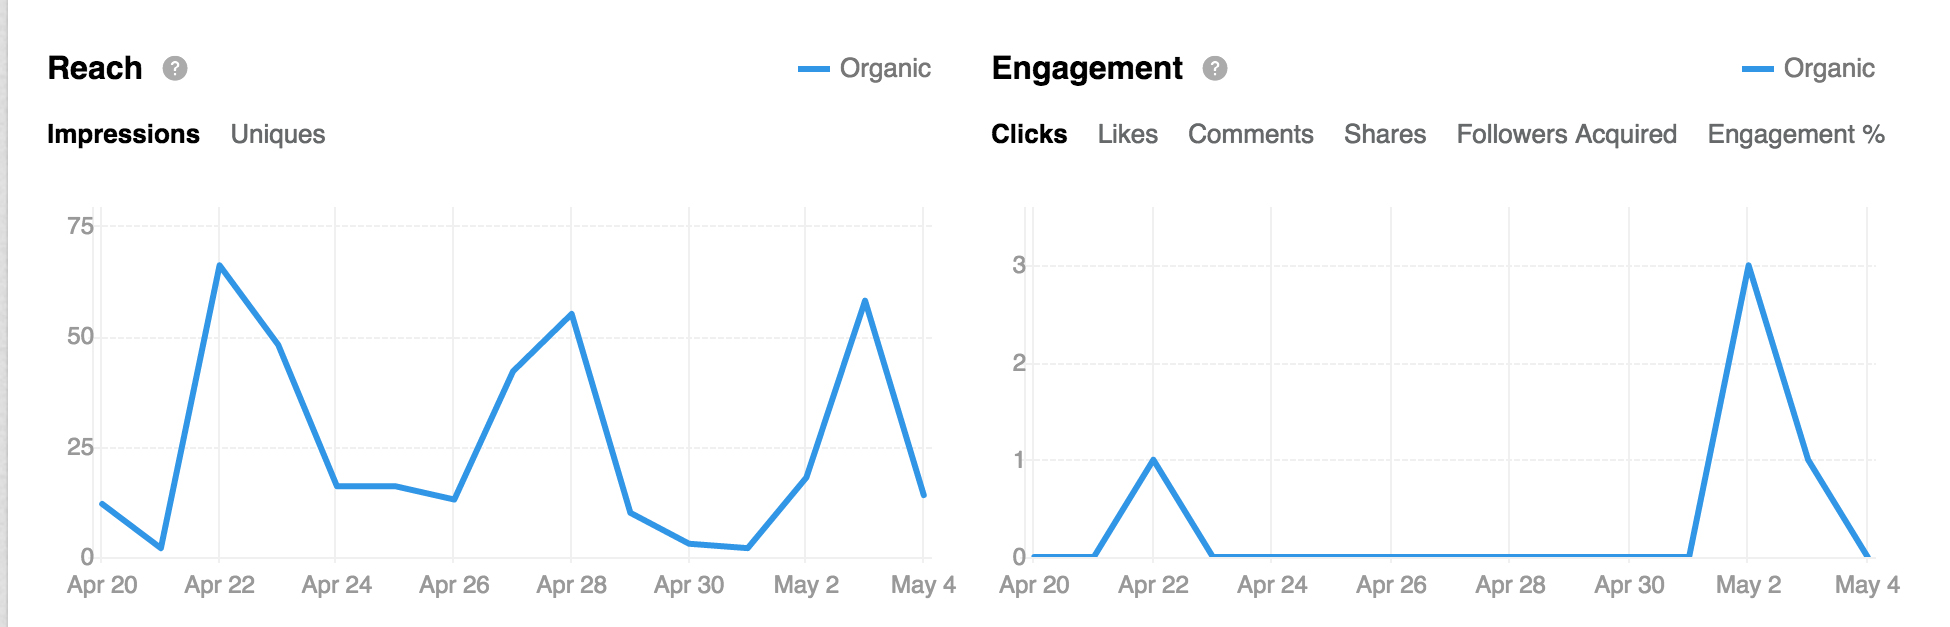
The next section shows Reach and Engagement using line graphs. You can adjust the date range using the tool in the upper right corner.
In the Reach section, the line graph shows the number of impressions, i.e., the number of times your updates were seen on a daily basis. You can hover over the points the graph to see totals for each day.
The Engagement graph shows analytics for Clicks, Likes, Comments, Shares, Followers Acquired, and Engagement %. Click on each label on the graph to see the analytics for each one.
Scroll down to see the Followers section, which starts with Follower Demographics. This is a breakdown of who’s following your company using 5 types of demographic data. Use the dropdown to filter by Seniority, Industry, Company Size, Function and Employee.
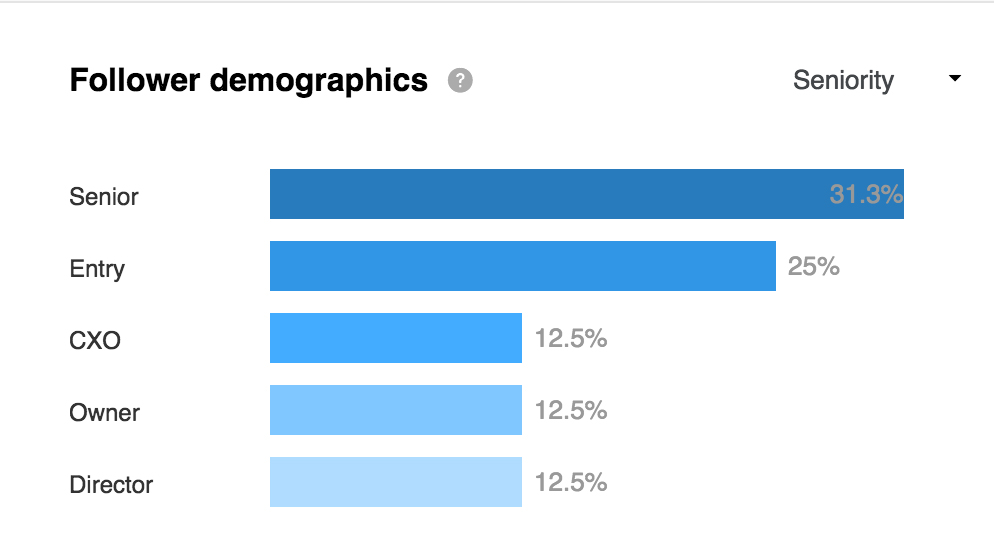
LinkedIn Analytics — Follower Demographics
The Follower Trends graph shows how your number of followers has changed over a specified amount of time.
How You Compare shows your total number of followers compared to other similar companies.
The last section is Visitors, which is divided by:
Page Views: How many times your company page was viewed.
Unique Visitors: How many LinkedIn members visited your page (removes duplicate visits).
Visitor Demographics: a breakdown of who’s visiting your Company Page using 5 types of demographic data. Use the dropdown to filter by Seniority, Industry, Job Function, Company Size, etc.
Google Analytics, Facebook and Twitter all feature widgets that allow you to export data onto an excel (or CSV) spreadsheet to use for reporting. However, at this writing, LinkedIn Analytics does not offer this functionality. We’ll be writing about getting started with data reporting in a future blog post. You can sign up here to receive our blog by email.
Digital analytics provide great insight into the effectiveness of your website and social media, and should be monitored regularly. Not mentioned in this post are analytics for online ads, email campaigns, hashtags, and other social media channels, which should also be tracked using different methods.
What do you think? If you have any questions, please let me know in the comments.
Caroline D. Quinn is the founder of Quinnovative Marketing, a marketing services company based in Plymouth, MA. An experienced marketing pro who delivers results-driven marketing, she is focused on helping small and mid-size business owners succeed. You can follow Caroline on Twitter at @Carolinedquinn or @QuinnovativeMkt, or on Quinnovative’s Facebook page.